GoodWe SEMS+ App: A Beginner's Guide to Monitoring Your Solar
If we've installed a GoodWe inverter or battery for you, the SEMS+ app is where you'll see everything your system is doing: how much solar you're generating, where that energy is going, and how your battery is tracking. SEMS stands for Smart Energy Management System, and SEMS+ is GoodWe's latest app for keeping an eye on it all from your phone.
Here's a plain-English walkthrough of the app for first-time users.
Getting the App and Logging In
SEMS+ is free and available for both iPhone and Android. Search "SEMS+" in the App Store or Google Play. When we commission your system, we create your monitoring account and link your inverter to it, so all you need to do is log in with the details we provide. If you've misplaced your login, give us a call and we'll sort it out.
There's also a web version at semsportal.com if you'd rather check your system from a computer, and the same login works for both.
The Home Screen: Your Energy Flow at a Glance
The first thing you'll see is a live energy flow diagram: a simple picture of your house showing solar panels, battery, home and grid, with arrows showing where power is moving right now.
In a few seconds you can tell:
- •How much your panels are generating right now
- •Whether your battery is charging or discharging
- •How much power your home is using
- •Whether you're importing from or exporting to the grid
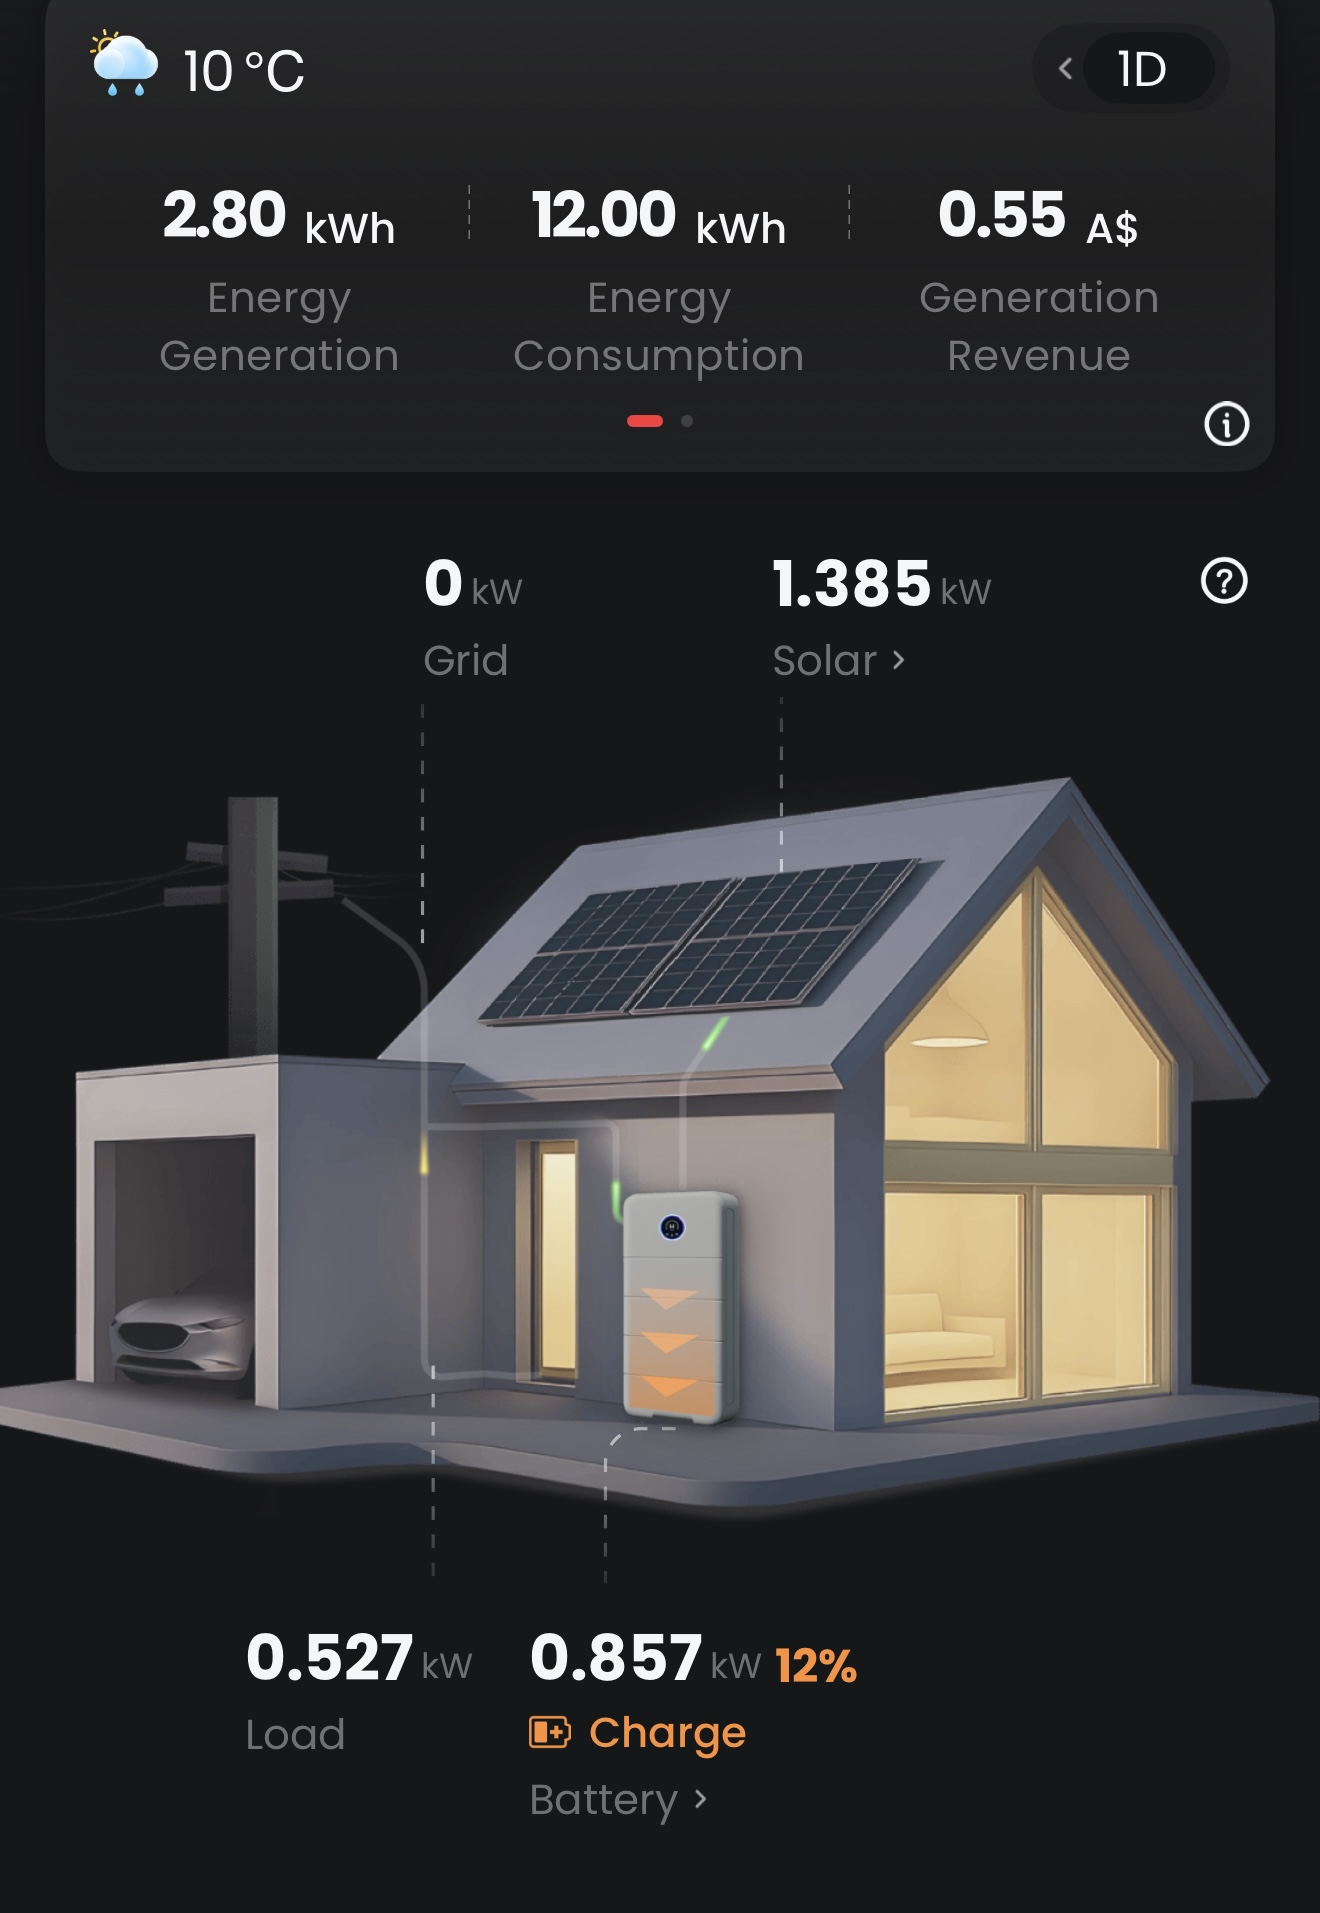
Alongside the diagram you'll find quick daily statistics, so you can see today's generation and consumption without digging through menus.
Tracking Your Production Over Time
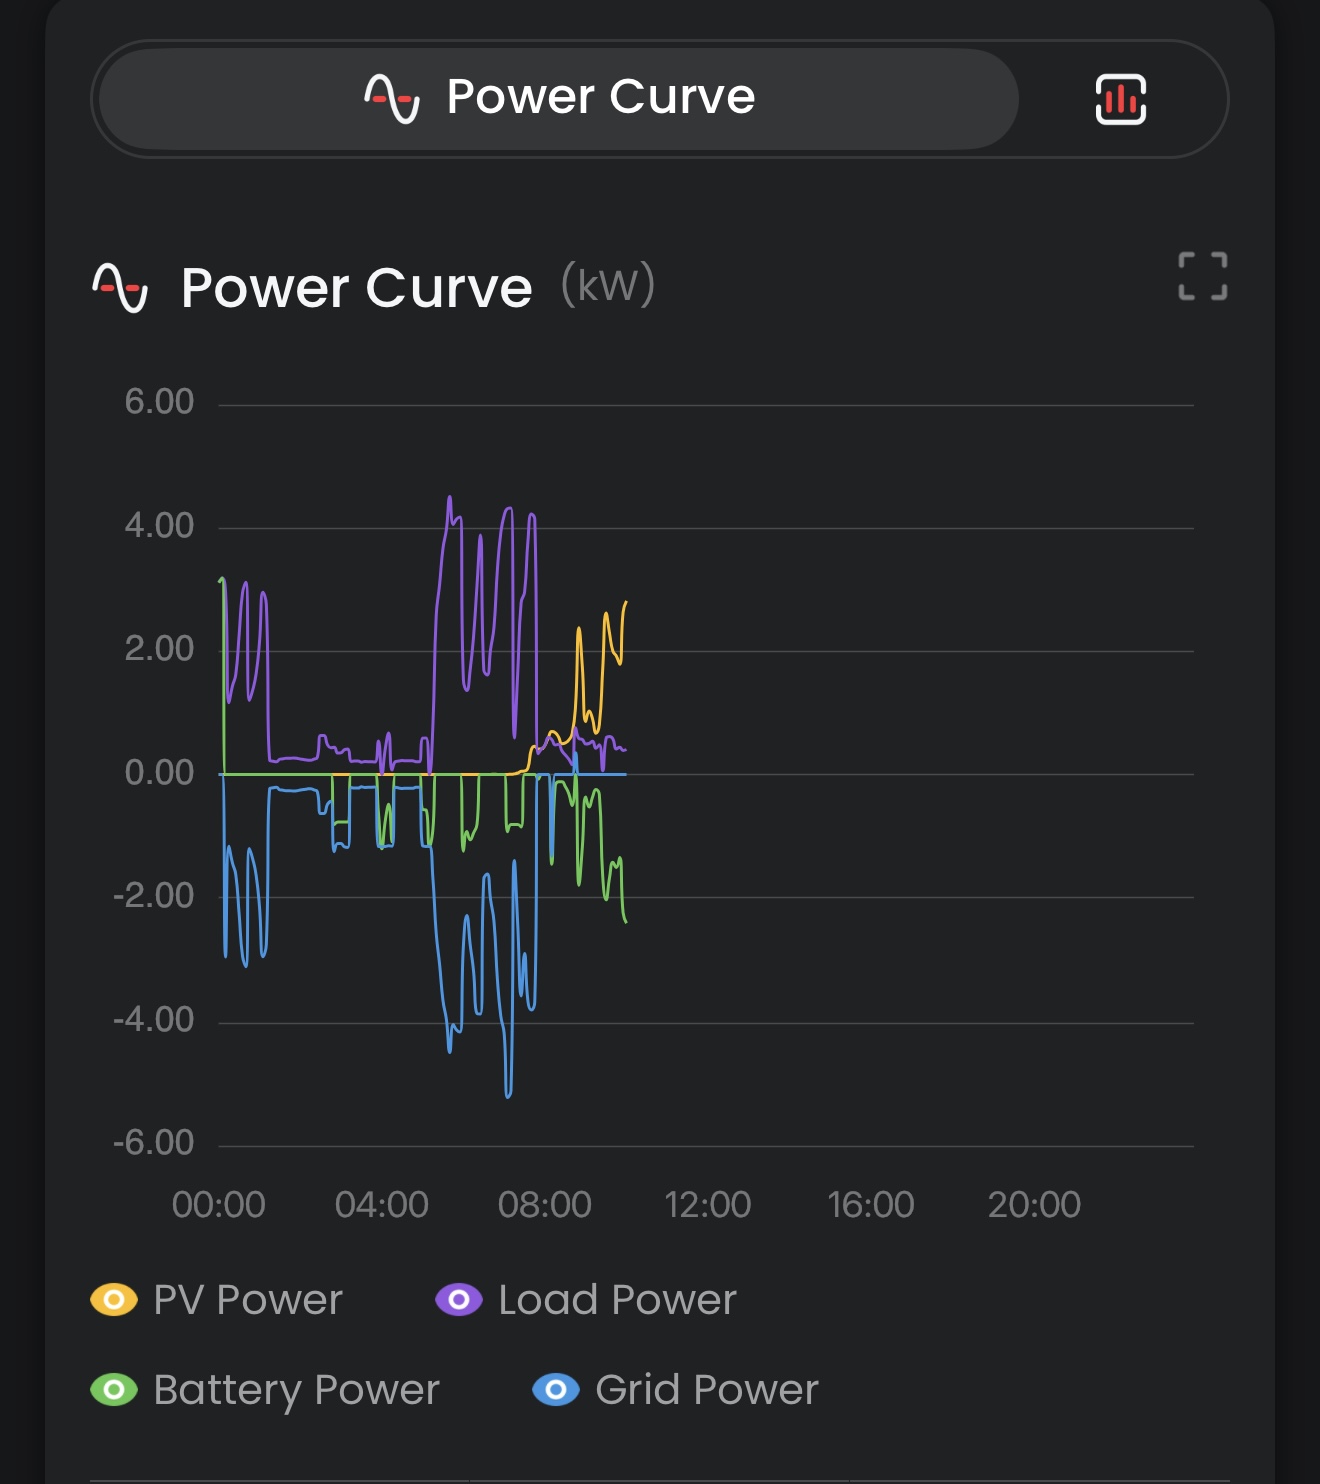
Tap into the charts and you can view your system's performance by day, month, year, or across its whole lifetime. The Power Curve view shows live power in kW through the day, so you can watch solar ramp up in the morning and see exactly when your home draws from the battery or grid.
The Energy Monitoring view totals it all up in kWh, and it is the best way to understand your system's patterns. You'll see generation climb through spring and summer, and you can compare days and months side by side.
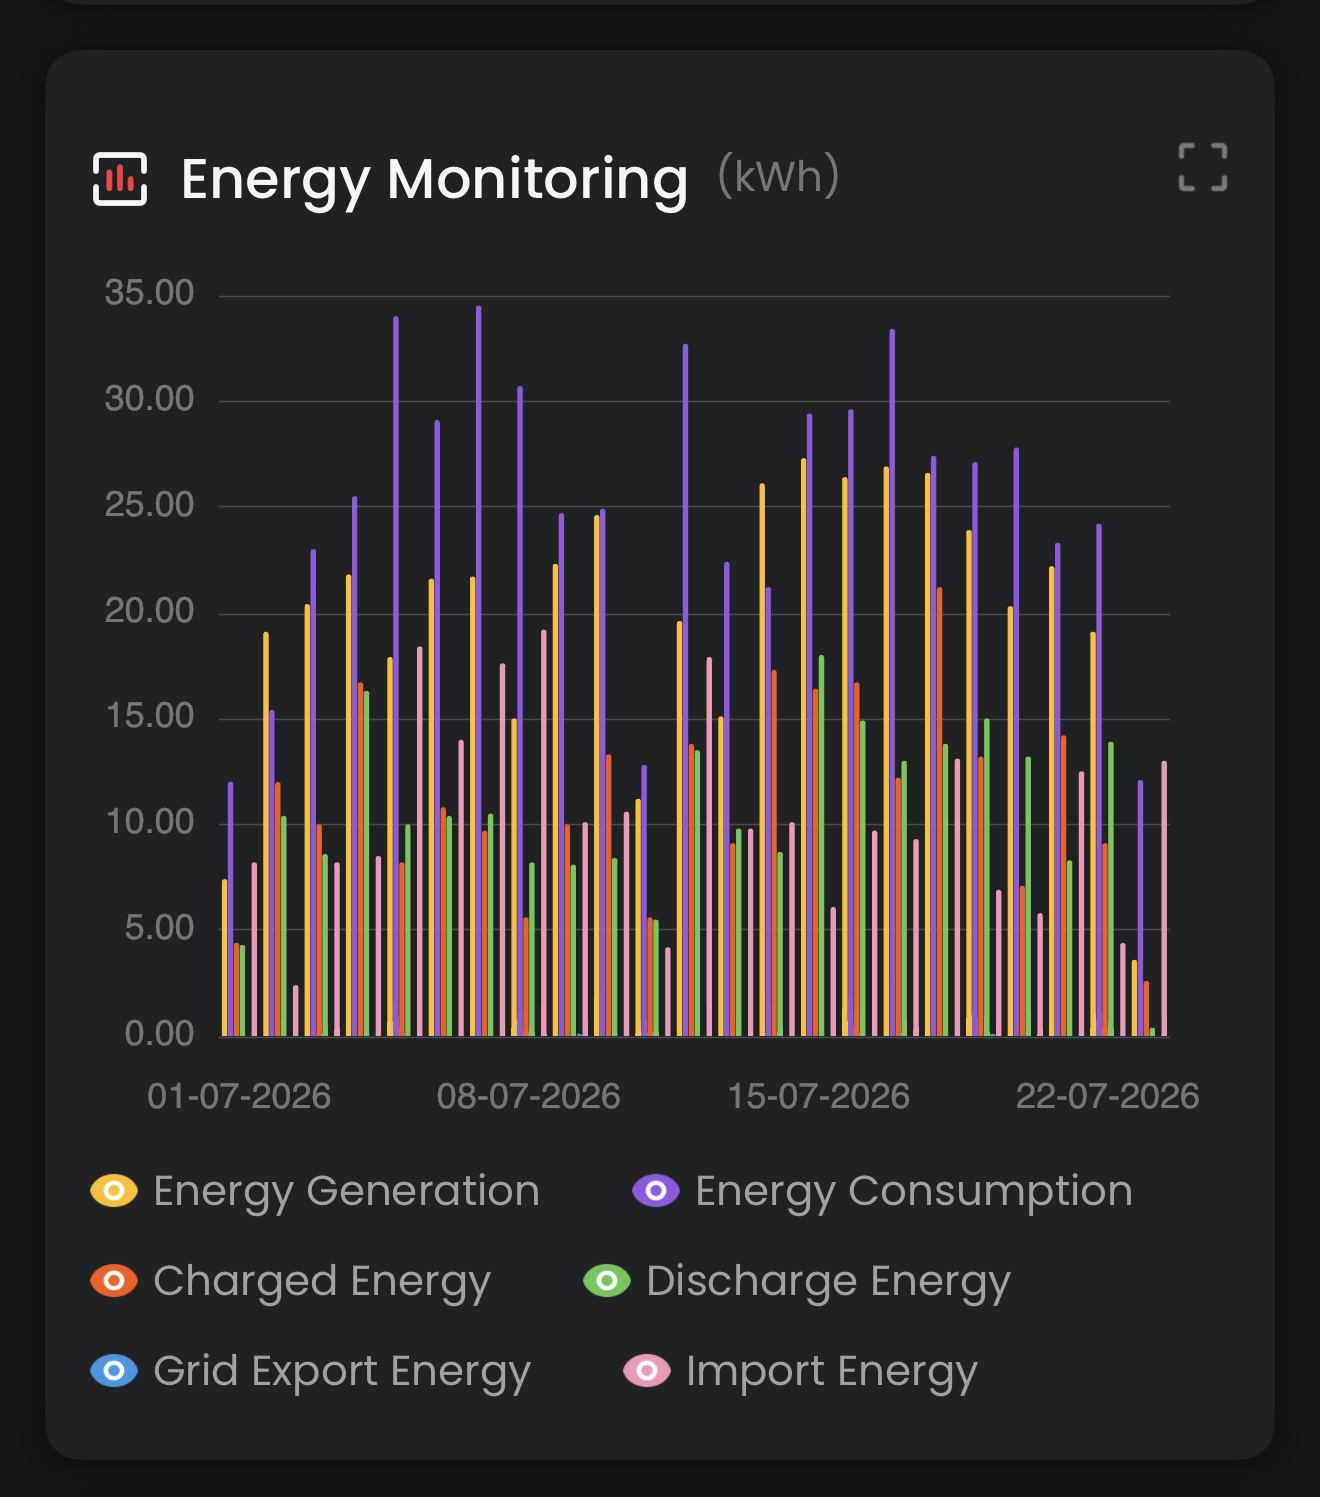
It's also handy for spotting anything unusual. If a day looks well below its neighbours and the weather was clear, it's worth a closer look (or a call to us).
Battery State of Charge and Tariffs
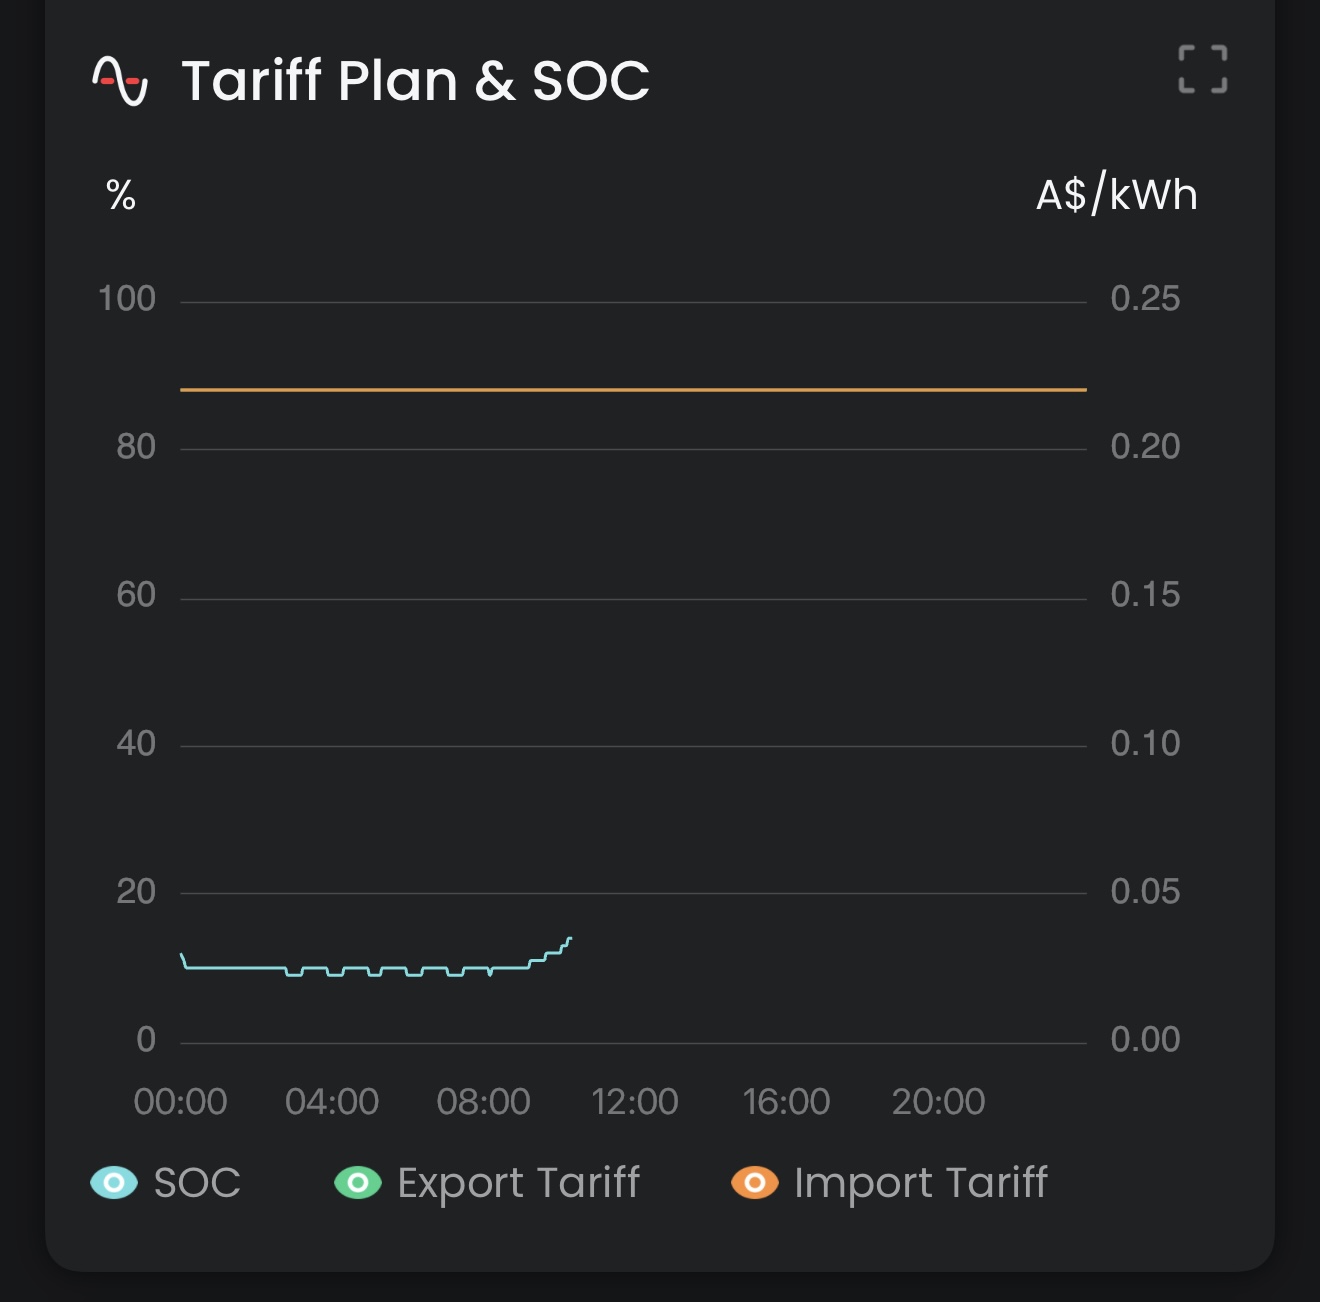
If you have a GoodWe battery, the app shows its state of charge (SOC), the percentage of stored energy remaining, and whether it's charging or discharging at any moment.
SEMS+ also has a tariff section where your electricity import and export rates can be entered. With your tariffs set, the app can estimate what your system is saving and earning, rather than just showing raw kilowatt-hours.
Consumption: Where Your Energy Goes
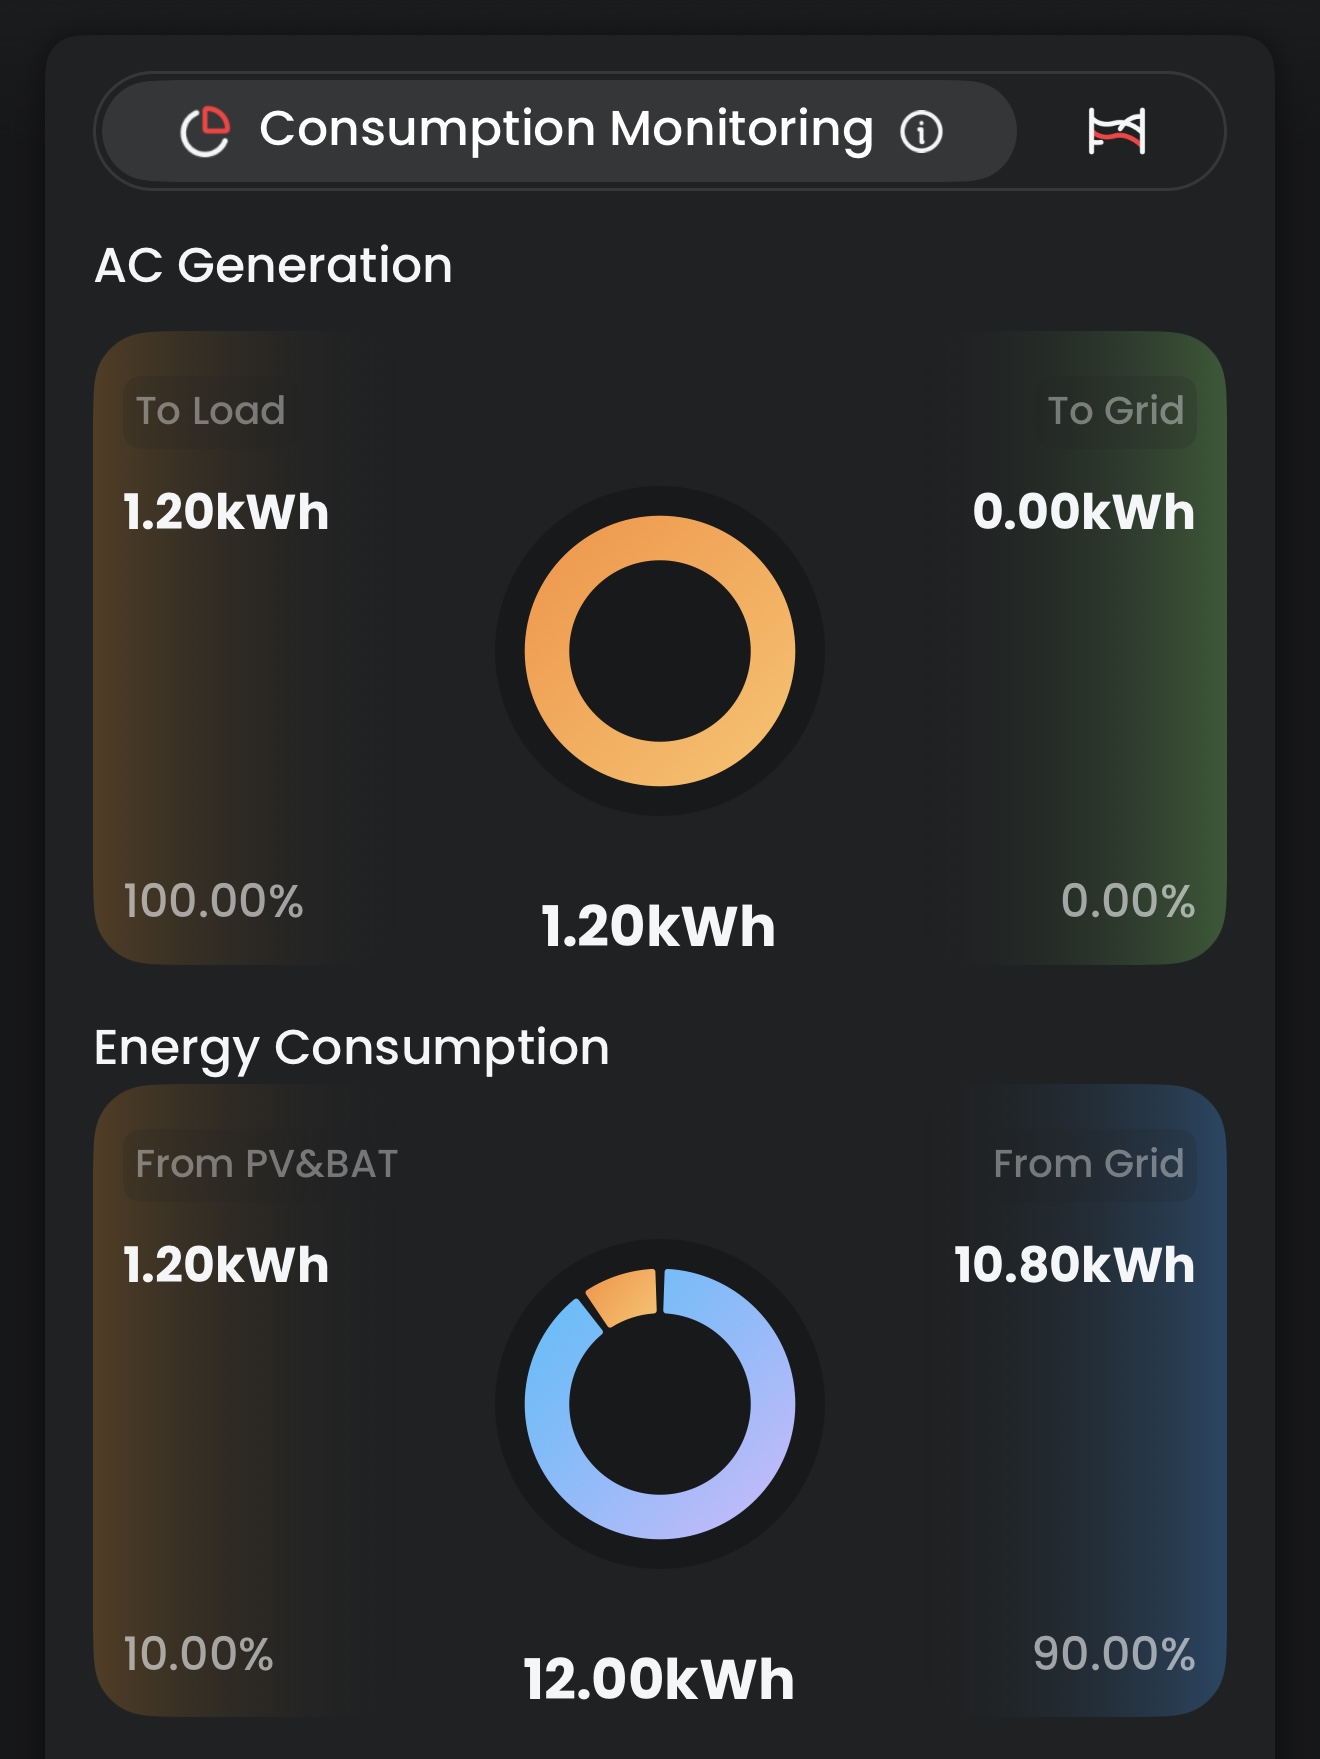
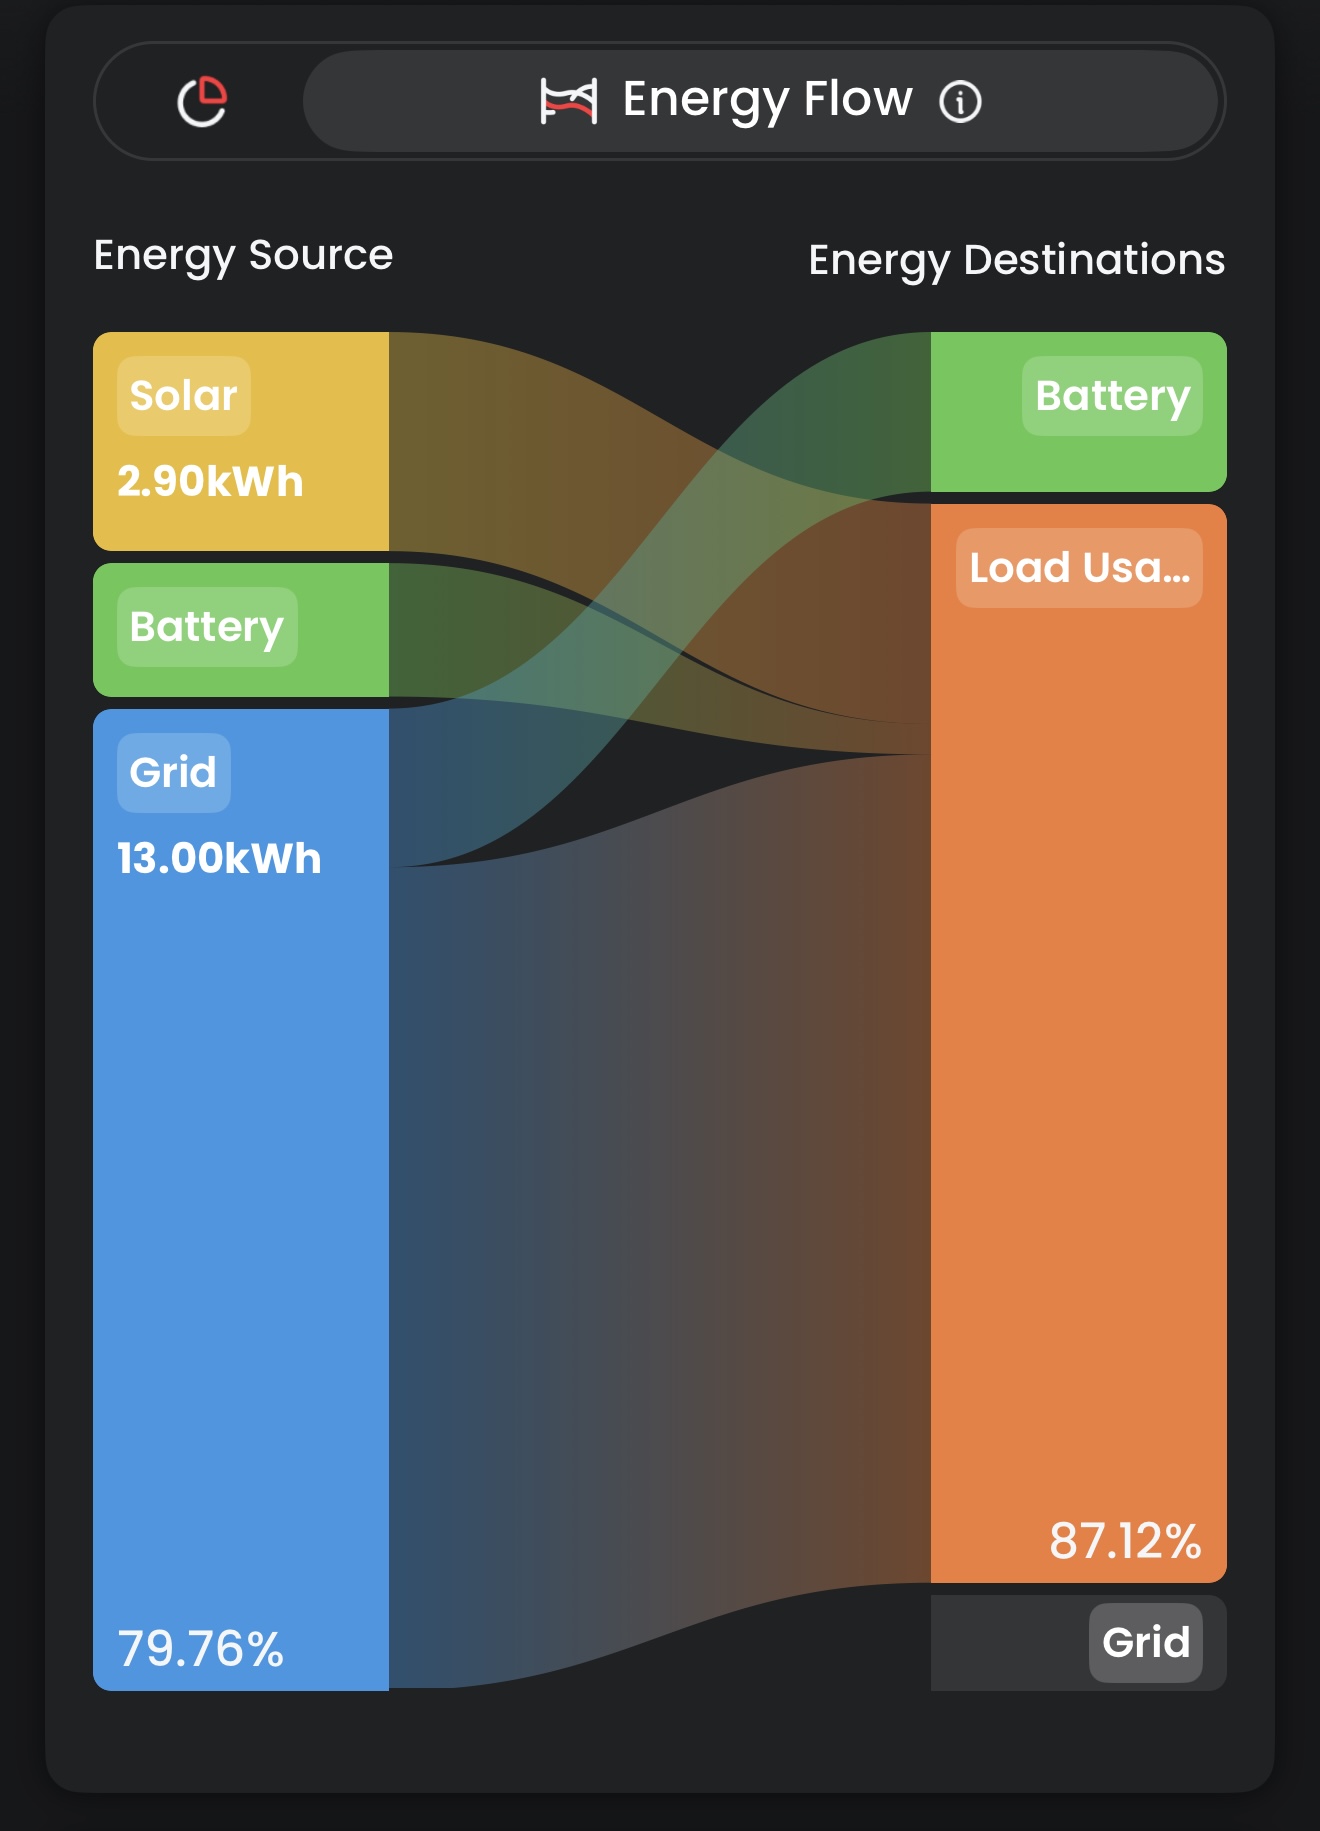
With a smart meter installed as part of your system, SEMS+ breaks down where your solar generation is going (into your home, your battery, or out to the grid) and where your home's usage is being drawn from. This is the number to watch if you want to increase self-consumption, which is where the real savings are in South Australia.
Environmental Impact
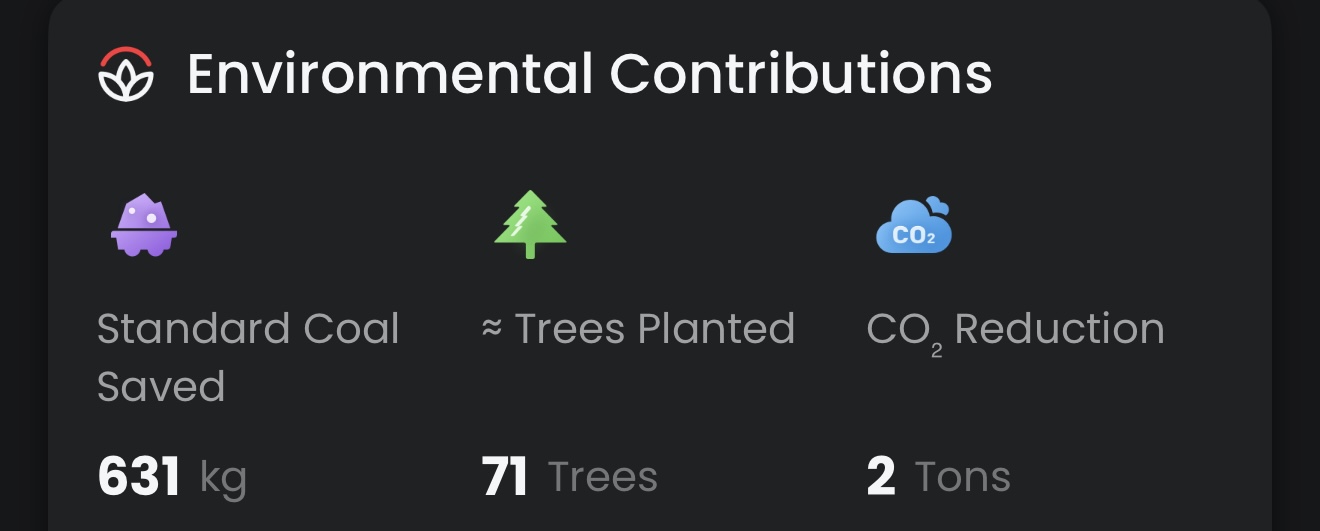
A small but satisfying feature: the app tallies your system's environmental contribution over its lifetime: CO2 emissions avoided, the equivalent number of trees planted, and coal saved. A nice reminder of what your roof is quietly achieving.
Alerts and Alarms
SEMS+ can notify you if your system raises a fault or goes offline, and you can view alarm details in the app. Two things worth knowing:
- •Offline usually just means Wi-Fi. If your internet drops out or you change your router or Wi-Fi password, the inverter loses its connection and the app stops updating. Your system keeps generating as normal. It just can't report in. Reconnecting the inverter to your new Wi-Fi fixes it.
- •Genuine fault alarms are worth acting on. If you see one you don't understand, call us on 0474 320 534 and we'll check it remotely.
What Devices Does SEMS+ Work With?
SEMS+ supports GoodWe's ecosystem of devices: inverters, batteries, smart meters, data loggers and EV chargers. If your whole system is GoodWe, everything appears in the one app.
We Set It All Up for You
Every solar and battery system we install is commissioned with monitoring configured before we leave: app account created, inverter connected, and a quick tour of the dashboard so you know what you're looking at. If you'd like a refresher, or your system was installed by someone else and monitoring was never set up properly, get in touch and we'll get you sorted.
Frequently Asked Questions
Yes. SEMS+ is free to download and use on both iOS and Android, and the semsportal.com web version is free as well. Monitoring is included with every GoodWe system we install.
Need Expert Advice?
Our team is ready to help with your electrical or solar project. Get a free, no-obligation quote today.